
Previous PEC research undertaken in partnership with the Centre for Cultural Value shows how the creative workforce has been hit hard by the coronavirus (COVID-19) pandemic. In particular, that job losses have been particularly severe in Music, performing and visual Arts, hours worked have declined in almost all parts of the creative workforce, the creative workforce has been bleeding disproportionate numbers of younger workers, and creative freelancers have experienced similar declines. How differently has the creative workforce fared compared with the rest of the UK workforce in the pandemic? Answering this question is important for policymakers who must assess the robustness of calls from the creative industries for targeted support measures.
In this blog we draw on initial findings from a PEC research collaboration with the University of Westminster and the Economic Statistics Centre of Excellence to analyse changes in the UK’s creative workforce since 2001. As well as identifying particular sources of growth, the project is looking at the dynamics of creative labour markets – in particular, the extent of transitions in and out of creative occupations – and whether these dynamics differ in the UK’s creative clusters. Key features of the study are that we compare findings for creative occupations with those for the rest of the workforce and will use econometric models to test for the statistical significance of differences. A research report will be published later in the summer of 2021.
This blog looks at the experience under the pandemic in particular but in some cases provides longer time series to provide the historical context. It is based on individual-level data from the Office for National Statistics’ Labour Force Survey (LFS) up to and including the last quarter of 2020. Note that the results are presented for the creative workforce, that is those employed in creative occupations whichever industry they are employed in, as opposed to the creative industries workforce (which includes individuals employed in non-creative occupations in the creative industries). Results for the creative industries workforce will be included in the final report. As with previous studies, we use Department for Digital, Culture, Media & Sport (DCMS) occupational groups to present results as sample sizes do not permit presentation of the results at the 4-digit Standard Occupational Classification (SOC) code level.
Workers in creative occupations have grown in number, while the number of other workers has remained stable; however, Music, performing and visual arts has shrunk dramatically.
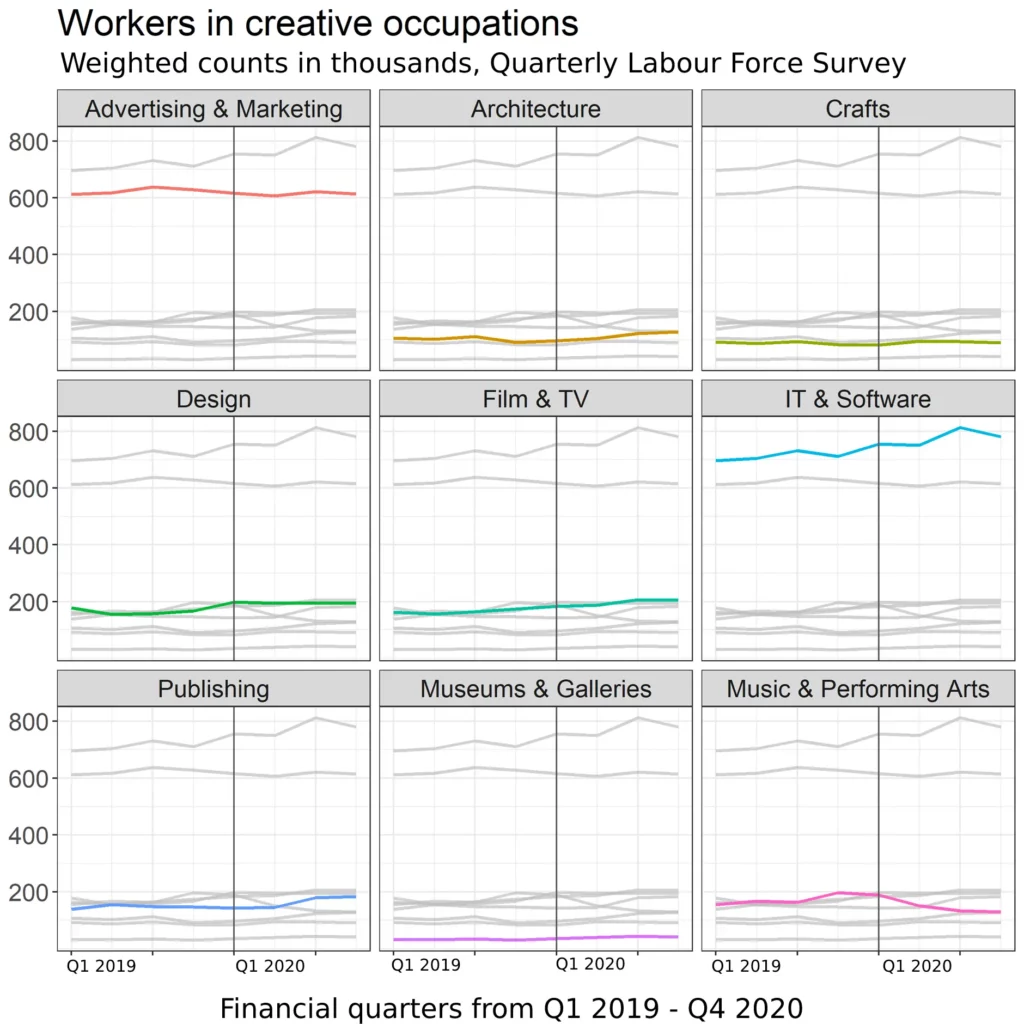
Figure 1 below plots the level of employment by sub-group of creative occupations from 2019 Q1 to 2020 Q4. The Government introduced the Coronavirus Job Retention Scheme (CJRS) at the tail end of 2020 Q1 on 20, March 2020. The Self-Employment Income Support Scheme (SEISS) was also announced in March 2020 but did not go live until 13 May 2020. While it had paid out around £21 billion to at least 2.6 million people by January 2021, it is estimated that, in the workforce as a whole, around 1.8 million self-employed and 700,000 company owner-managers were not eligible for the scheme.
Each panel within Figure 1 shows in colour the trend for the occupation group identified in the heading and, for comparison, shows in grey the trends for all other creative occupation groups. From this picture, you might be forgiven for thinking the impact of COVID-19 on the creative workforce has not been so bad after all. The numbers in work have remained broadly stable across most creative occupations. In total, the creative workforce actually grew by 6% in the year to 2020 Q4, compared to essentially no change in the non-creative workforce.
However, major exceptions are Music, performing and visual arts (Music & Performing Arts’) which experienced a decrease of 68,000 in the year to 2020 Q4 and IT, software and computer services (‘IT & Software’) which saw an increase of 69,000 over the same period.
The crisis in Music, performing and visual arts has been even greater than these numbers suggest. The fall in employment represents a 34% shrinkage compared with a 10% increase in the case of the much bigger IT, software, and computer services workforce. An important proviso is that these aggregate groupings can mask large variations between individual occupations. For example, we know that employment of cinema staff is likely to have been hit by more than employment of film production workers, even if we cannot reliably identify this level of detail in the data. BFI data confirms there was a strong resumption in physical production activity from mid-July 2020 onwards, while in UK cinemas, in contrast, admissions in 2020 were less than 25% of levels seen in the previous three years.
Figure 1: The numbers employed in creative occupations, 2019-2020
Among those in work, hours have fallen across almost all creative occupations, in line with the wider workforce, though the extent of the fall varies greatly.
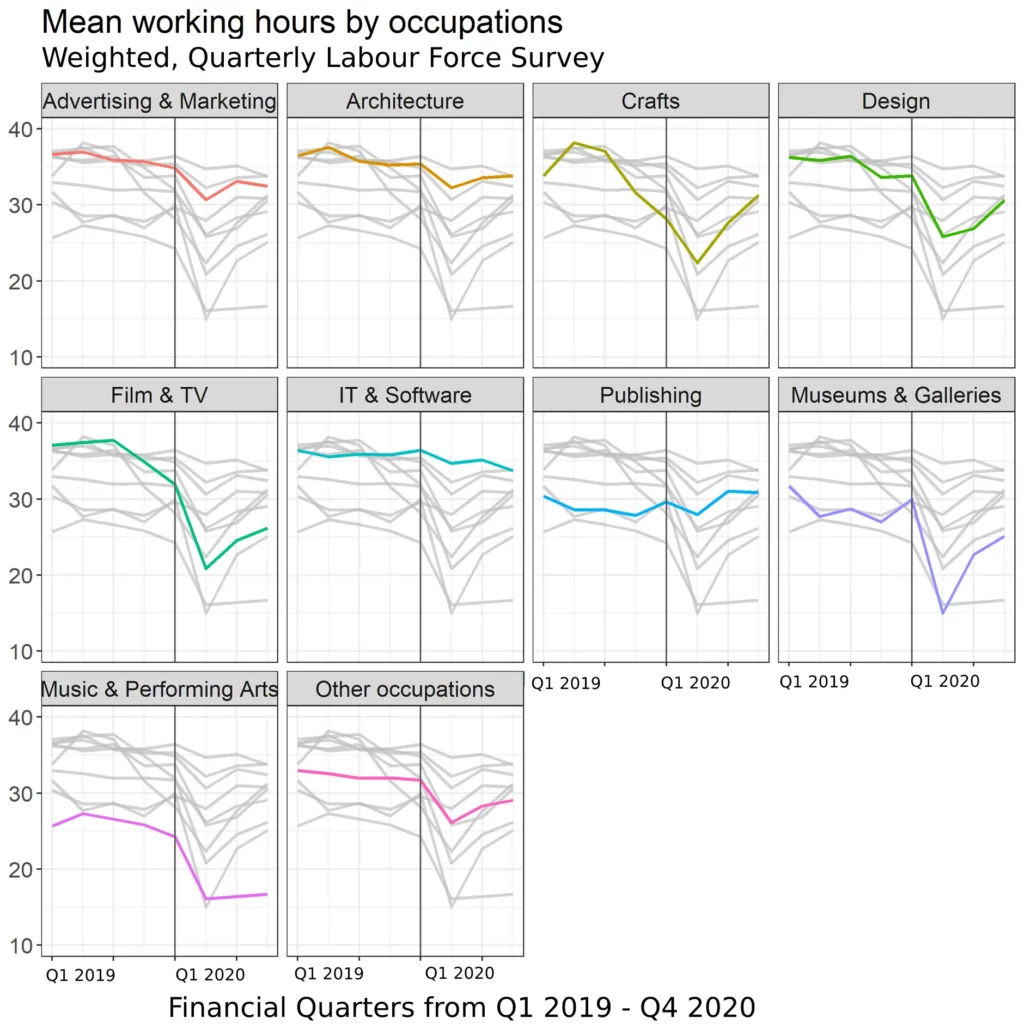
Looking at average hours worked per week reveals a very different picture (Figure 2). Now the widespread effect of COVID-19 is clear. All occupation groups except Publishing have experienced a decline in mean hours worked. Relative to the workforce as a whole, Film, TV, video, radio and photography (‘Film & TV’), Museums, galleries and libraries (‘Museums & Galleries’) and Music, performing and visual arts (‘Music & Performing Arts’) have all been badly hit, with the latter being unique in experiencing no bounce back when the first national lockdown ended. Comparing 2020 Q4 with 2019 Q4, we see that:
- Those working in creative occupations worked three fewer hours on average per week, a reduction of eight per cent. This is broadly the same as for the rest of the workforce.
- Film, TV, video, radio and photography and Music, performing and visual arts worked nine fewer hours on average per week. This equates to reductions of 25 per cent and 35 per cent, respectively.
- Those in Publishing roles bucked the trend, working three hours more on average, an increase of 11 per cent. [1]
Figure 2: Hours worked by those in creative occupations, 2019-2020
The key explanation for the combination of stable employment levels and declining hours worked is that the government’s Coronavirus Job Retention Scheme and Self-Employment Income Support Scheme meant that large numbers remained in their jobs but at reduced or zero hours.
Self-employment is especially important to the creative workforce; during 2020, self-employment as a share of creative workers fell further than among workers in other occupations.
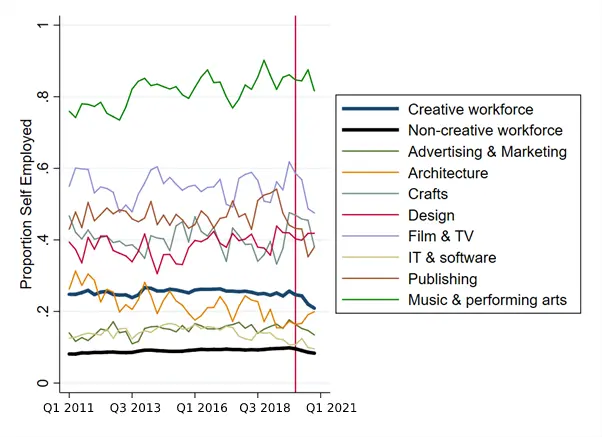
Figure 3 shows that self-employment is especially important in the creative workforce (compare the thick lines). This is true across all occupation groups but is particularly marked within Music, performing and visual arts and Film, TV, video, radio and photography. In the Labour Force Survey as a whole, there has been an increase in the number of people moving from self-employment to employee while staying in the same role. Figure 3 shows that the proportion of the creative workforce that is self-employed has fallen to a greater extent than is true for other workers since the onset of the pandemic. At the level of occupation groups, the COVID-19 dip is masked by quarter-on-quarter variations but appears to have particularly affected Film, TV, video, radio and photography, Crafts, and Publishing.
Figure 3: The proportion of workers who are self-employed, by occupation 2011-2020
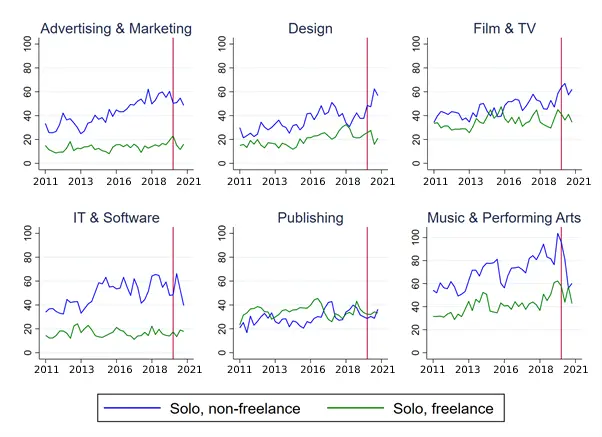
The role of freelancers – one particular form of self-employment – in creative production has long been held as a factor that differentiates the creative workforce from others and a harbinger of how production will in the future be organised in the wider economy. Figure 4 breaks down self-employment into three categories, according to how individuals describe their main job in the Labour Force Survey:
- Non-solo – those with employees.
- Solo, non-freelance – those on their own or with partner(s) but no employees and who do not identify they do freelance work.
- Solo, freelance – those on their own or with partner(s) but no employees and who do indicate they do freelance work.
Figure 4 confirms that freelancers are more important to the creative workforce than to the rest of the workforce. For example, in 2019 Q4 (the last whole pre-pandemic quarter), 31% of self-employed creative workers identified themselves as freelance workers compared with just 10% of self-employed non-creative workers. Interestingly, however, the growth seen in the self-employed creative workforce over the past decade is driven more by solo workers who do not identify themselves as freelance in the Labour Force Survey, including sole directors of their own limited businesses and partners. This is also a group that have been hit hard in the coronavirus pandemic, as they have in the workforce more generally. Take the beleaguered Music, performing and arts visual workforce, where in Figure 5 we can see that amongst solo workers it is non-freelancers who have taken the biggest hit. [2]
Figure 4: Type of self-employment, for creative and non-creative workforce 2011-2020 (thousands)
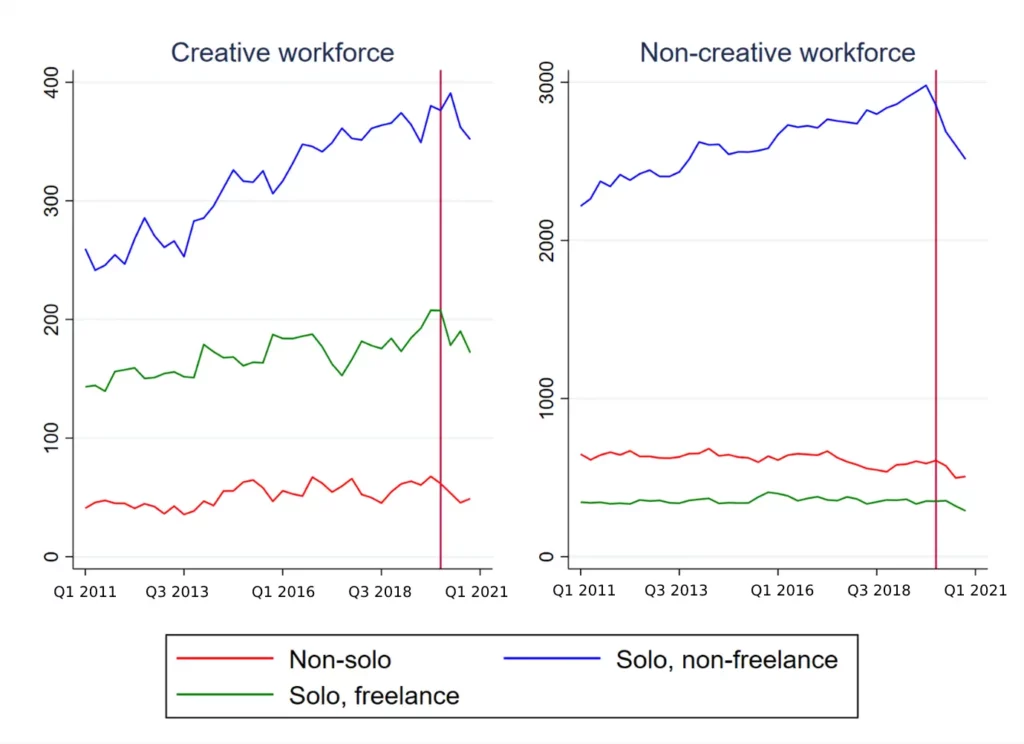
Figure 5: Solo self-employed: non-freelance and freelance by creative occupation, 2011-2020 (thousands)
So, how differently has the creative workforce fared under COVID-19?
Our findings point to considerable variation within the creative workforce. Those employed in IT, software and computer services occupations appear to have fared better than the non-creative workforce, possibly because remote working is more suited to such occupations. Several other creative occupation groups have been harder hit – most notably, Music, performing and visual arts endured sustained falls in employment and reduced hours among those who kept their jobs. The pandemic also appears to have hit self-employment harder in the creative occupations than in the non-creative occupations. Beyond noting that the share of the workforce in self-employment is higher in creative occupations as a whole, there is substantial variation. It is perhaps in the Film, TV, video, radio and photography occupations that the self-employment share has fallen most in 2020. Self-employment trends are driven largely by solo non-freelance workers and here the creative workforce has seen a smaller proportionate drop in numbers than seen in the non-creative workforce. However, we also note that among the creative occupations, it is Music, performing and visual arts where the fall in solo non-freelance workers is the most pronounced; further compounding the impression of this being the hardest-hit group.
1. Note the significant variation in hours worked even prior to the pandemic. In 2019 Q4, those in creative occupations worked for 34 hours per week on average compared with 32 hours for those in other occupations. Within the creative workforce, however, those in Publishing, Museums, galleries and libraries and Music, performing and visual arts occupations all worked below average hours (with means of 28, 27 and 26 hours respectively). These differences may be accounted for by differences in the preponderance of part-time working and portfolio careers in occupation groups like Publishing and the Music, performing and visual arts; factors that we are investigating in our research.
2. Here, we encounter small sample sizes such that we cannot report non-solo workers. For the solos, only those occupations for which we have sufficient observations for both freelance and non-freelance are included in the Figure.
Photo by Lachlan Ross
The PEC’s blog provides a platform for independent, evidence-based views. All blogs are published to further debate, and may be polemical. The views expressed are solely those of the author(s) and do not necessarily represent views of the PEC or its partner organisations.
Related Blogs
Measure what matters: Priority pathways and Creative Higher Education
Bernard Hay, Creative PEC's Policy Director, investigates the surprising absence of creative subject…

11 actions for the cultural and creative industries in the age of AI
A guide to help the cultural and creative industries address the rise of AI, from the GCEC.
Creative Resilience in Times of Crisis
Introducing A Global Agenda for Creative Resilience, an 11-point strategic framework for strengtheni…
Reporting from the Creative PEC Research Symposium 2026
Bringing people together from across academia, industry, and government for discussion and debate on…

Keeping creative options open for everyone
How does creative study allow us to express ideas, shape how we see the world, and contribute to vib…
Coworking spaces as informal skill ecosystems for the creative workforce
How coworking spaces have become an increasingly important component of the creative economy.
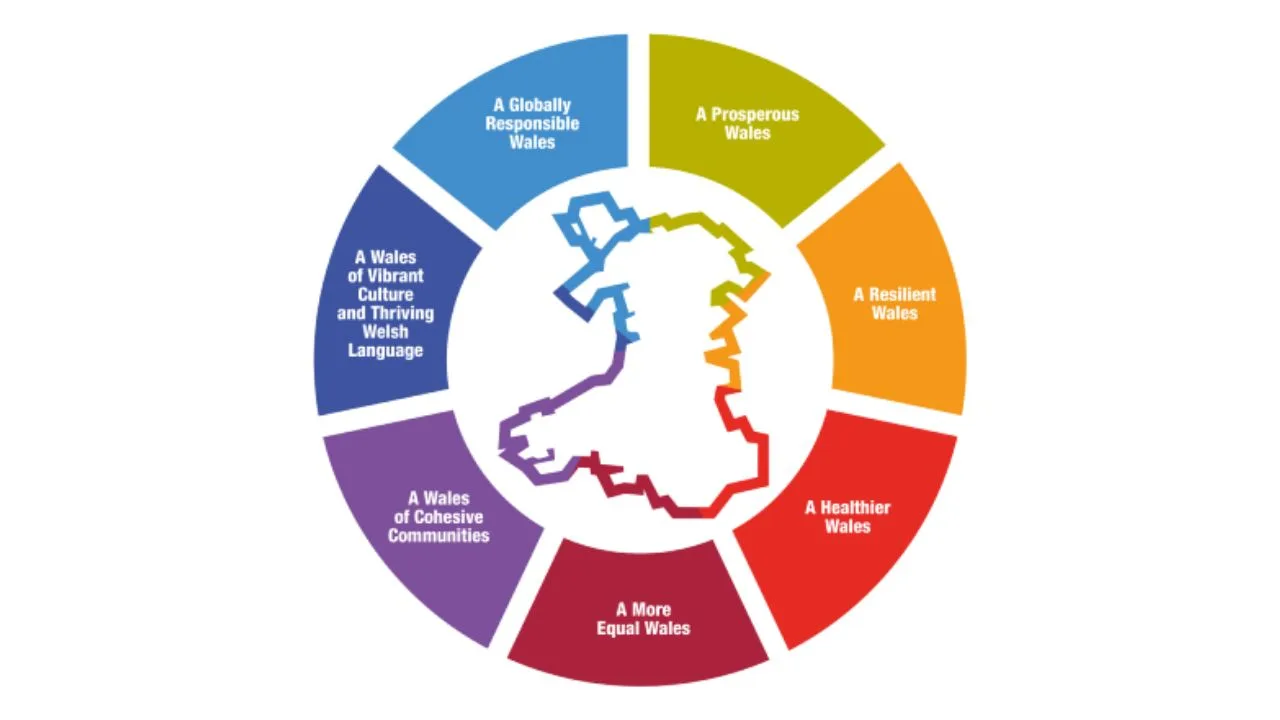
From Wales to the World: Why International Cultural Policy Needs a Future Generations Lens
Can international cultural policy be shaped by focusing on future generations?
10 facts about Creative Industries growth potential
Discover ten key findings from the report 'High-Growth Potential Firms in the UK's Creative Industri…
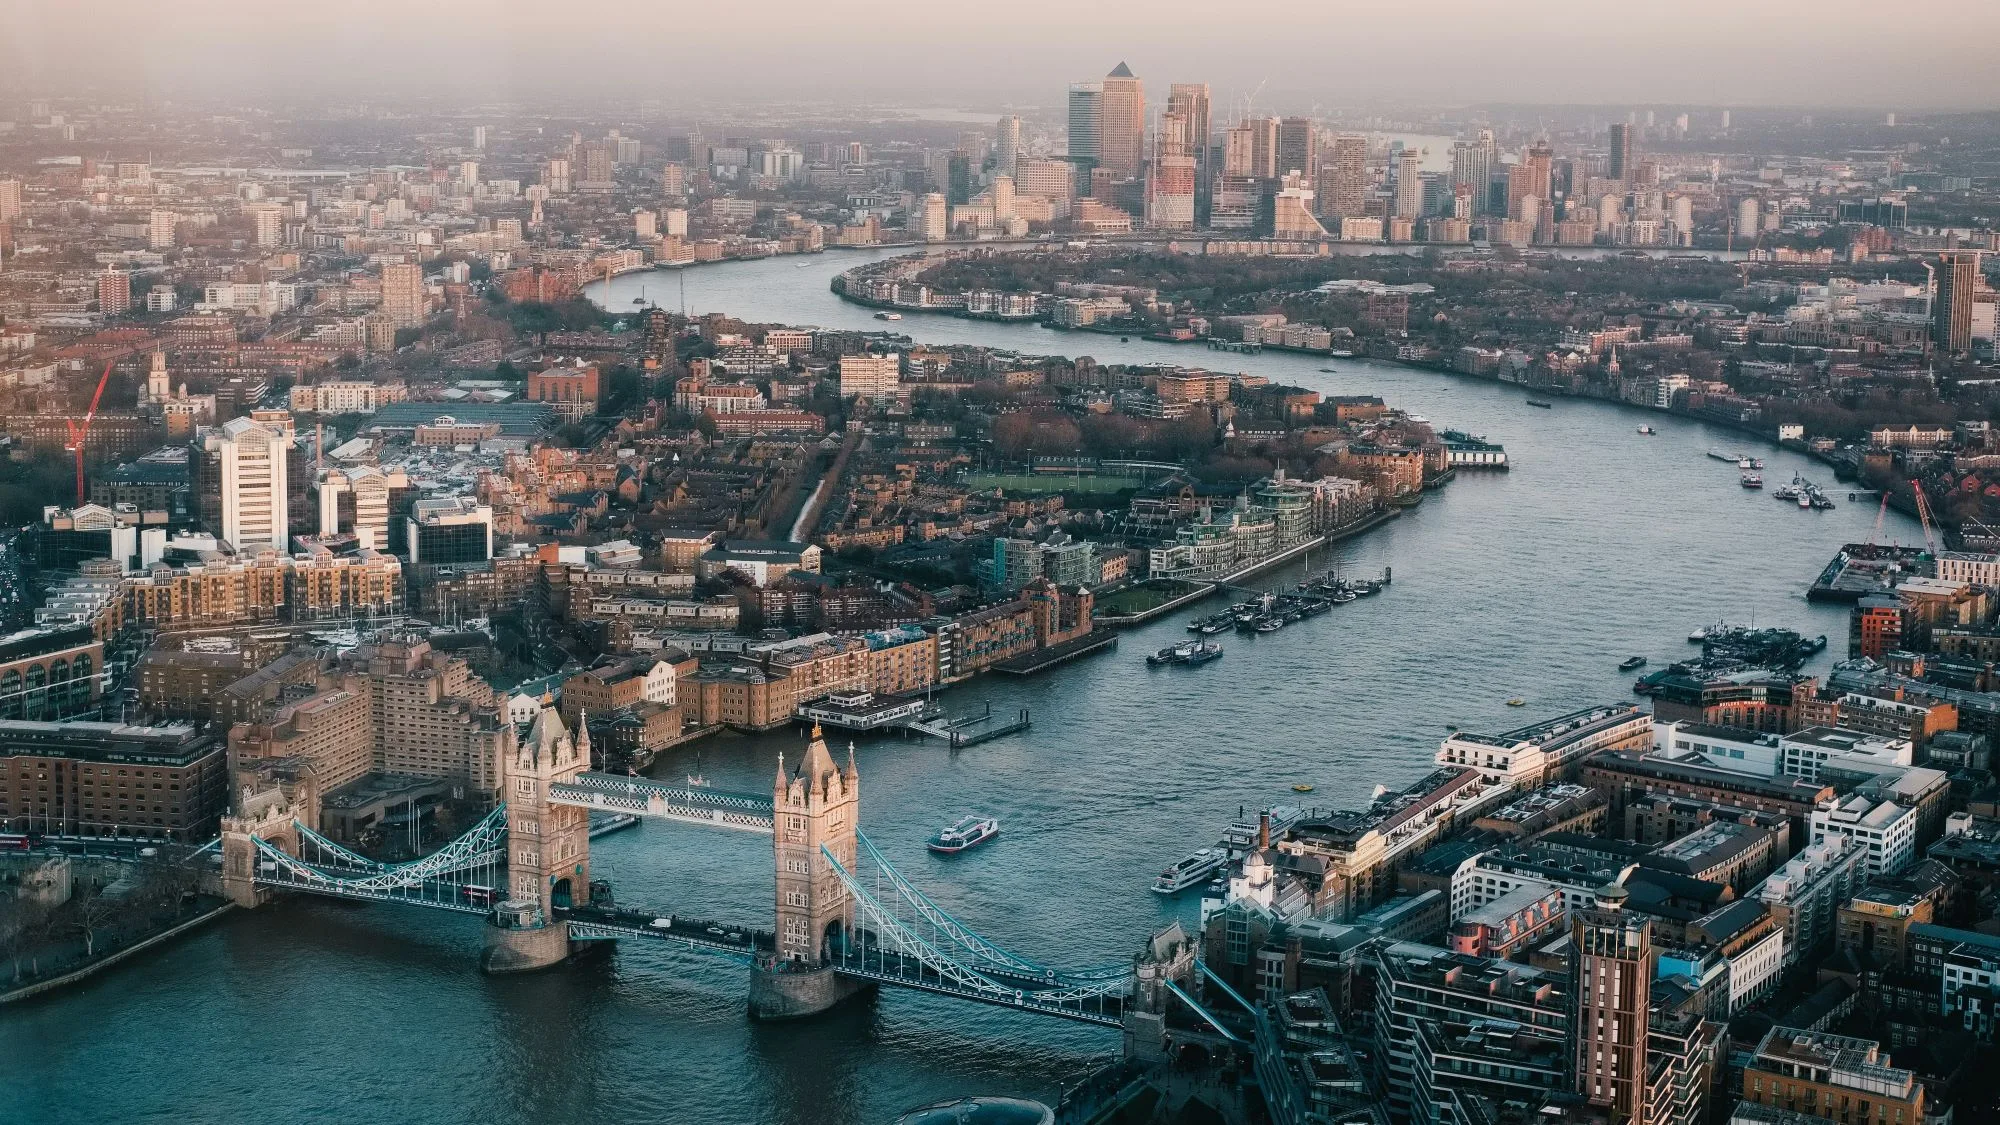
Why London is investing in Creative Enterprise Zones
London Mayor Sir Sadiq Khan announces £2.2 million in new funding for Creative Enterprise Zones.

Research resources on Creative Clusters
We’ve collated recent Creative PEC reports to help with the preparation of your Creative Cluster bid…

What UK Job Postings Reveal About the Changing Demand for Creativity Skills in the Age of Generative AI
The emergence of AI promises faster economic growth, but also raises concerns about labour market di…
Creative PEC’s digest of the 2025 Autumn Budget
Creative PEC's Policy Unit digests the Government’s 2025 Budget and its impact on the UK’s creative …